The latest RRB Group D 2026 recruitment cycle has drawn massive participation from aspirants nationwide. Managing Level 1 positions across the country, the Railway Recruitment Boards (RRBs) have officially recorded a total submission pool that reflects immense public interest in these government career tracks. Aspirants tracking the competition level can now review the comprehensive data distributions to understand regional density and demographic applicant trends across all participating regions.
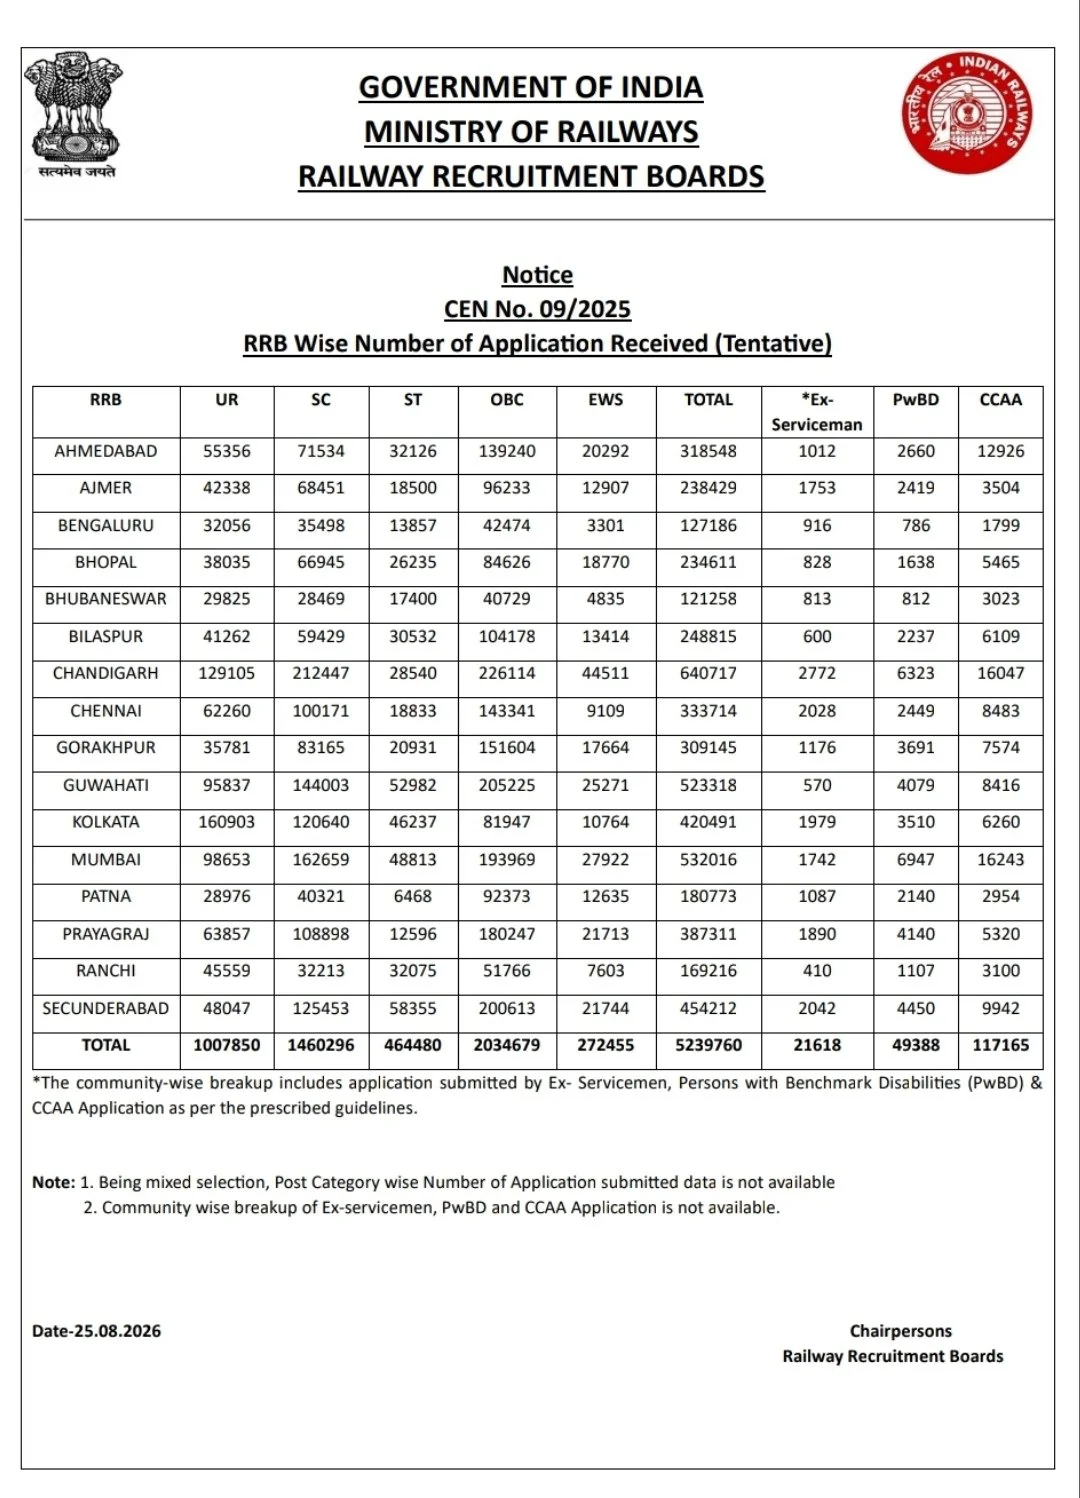
Overview of RRB Group D 2026 Applications
A grand total of 52,39,760 applications have been officially registered across the 16 RRB zones. Understanding this distribution is crucial for candidates evaluating their relative standing and regional competition trends. Below is a snapshot of the primary highlights:
| Particular | Details |
|---|---|
| Recruitment | RRB Group D 2026 |
| Post Level | Level 1 |
| Total Applications | 52,39,760 |
| RRB Zones | 16 |
| Highest Applications | Chandigarh |
| Highest Zone-wise Applications | 6,40,717 |
| Lowest Applications | Bhubaneswar |
| Lowest Zone-wise Applications | 1,21,258 |
| Highest Category-wise Applications | OBC |
| OBC Applications | 20,34,679 |
Category-Wise Breakdown of Applications
Participation varied considerably across social categories, with OBC candidates registering the largest share of submissions followed closely by SC candidates. Specialized categories such as Ex-Servicemen, PwBD, and CCAA also contributed significantly to the total applicant pool.
| Category | Applications Received |
|---|---|
| UR | 10,07,850 |
| SC | 14,60,296 |
| ST | 4,64,480 |
| OBC | 20,34,679 |
| EWS | 2,72,455 |
| Total | 52,39,760 |
Additionally, special quota registrations account for notable numbers across the country: Total Ex-Serviceman applications equaled 21,618, total PwBD applications reached 49,388, and total CCAA applications stood at 1,17,165.
Top and Bottom RRB Zones Checklists
Candidates often review regional concentration to understand where competition is most fierce. The highest density was observed in Northern and Western hubs, whereas Eastern and Southern regional boards recorded comparatively lower application volumes.
Top 5 RRB Zones by Number of Applications
- 1. Chandigarh: 6,40,717 applications
- 2. Mumbai: 5,32,016 applications
- 3. Guwahati: 5,23,318 applications
- 4. Secunderabad: 4,54,212 applications
- 5. Kolkata: 4,20,491 applications
| Rank | RRB Zone | Total Applications |
|---|---|---|
| 1 | Chandigarh | 6,40,717 |
| 2 | Mumbai | 5,32,016 |
| 3 | Guwahati | 5,23,318 |
| 4 | Secunderabad | 4,54,212 |
| 5 | Kolkata | 4,20,491 |
Bottom 5 RRB Zones by Applications
- 1. Bhubaneswar: 1,21,258 applications
- 2. Bengaluru: 1,27,186 applications
- 3. Ranchi: 1,69,216 applications
- 4. Patna: 1,80,773 applications
- 5. Bhopal: 2,34,611 applications
| Rank | RRB Zone | Total Applications |
|---|---|---|
| 1 | Bhubaneswar | 1,21,258 |
| 2 | Bengaluru | 1,27,186 |
| 3 | Ranchi | 1,69,216 |
| 4 | Patna | 1,80,773 |
| 5 | Bhopal | 2,34,611 |
Comprehensive Zone-Wise and Category-Wise Application Data
To gain a complete macro-view of the 2026 recruitment exercise, the table below consolidates the exact figures across all 16 Railway Recruitment Board zones, mapping out general, reserved, and special category applicants in detail.
| RRB Zone | UR | SC | ST | OBC | EWS | Total Applications | Ex-Serviceman | PwBD | CCAA |
|---|---|---|---|---|---|---|---|---|---|
| Ahmedabad | 55,356 | 71,534 | 32,126 | 1,39,240 | 20,292 | 3,18,548 | 1,012 | 2,660 | 12,926 |
| Ajmer | 42,338 | 68,451 | 18,500 | 96,233 | 12,907 | 2,38,429 | 1,753 | 2,419 | 3,504 |
| Bengaluru | 32,056 | 35,498 | 13,857 | 42,474 | 3,301 | 1,27,186 | 916 | 786 | 1,799 |
| Bhopal | 38,035 | 66,945 | 26,235 | 84,626 | 18,770 | 2,34,611 | 828 | 1,638 | 5,465 |
| Bhubaneswar | 29,825 | 28,469 | 17,400 | 40,729 | 4,835 | 1,21,258 | 813 | 812 | 3,023 |
| Bilaspur | 41,262 | 59,429 | 30,532 | 1,04,178 | 13,414 | 2,48,815 | 600 | 2,237 | 6,109 |
| Chandigarh | 1,29,105 | 2,12,447 | 28,540 | 2,26,114 | 44,511 | 6,40,717 | 2,772 | 6,323 | 16,047 |
| Chennai | 62,260 | 1,00,171 | 18,833 | 1,43,341 | 9,109 | 3,33,714 | 2,028 | 2,449 | 8,483 |
| Gorakhpur | 35,781 | 83,165 | 20,931 | 1,51,604 | 17,664 | 3,09,145 | 1,176 | 3,691 | 7,574 |
| Guwahati | 95,837 | 1,44,003 | 52,982 | 2,05,225 | 25,271 | 5,23,318 | 570 | 4,079 | 8,416 |
| Kolkata | 1,60,903 | 1,20,640 | 46,237 | 81,947 | 10,764 | 4,20,491 | 1,979 | 3,510 | 6,260 |
| Mumbai | 98,653 | 1,62,659 | 48,813 | 1,93,969 | 27,922 | 5,32,016 | 1,742 | 6,947 | 16,243 |
| Patna | 28,976 | 40,321 | 6,468 | 92,373 | 12,635 | 1,80,773 | 1,087 | 2,140 | 2,954 |
| Prayagraj | 63,857 | 1,08,898 | 12,596 | 1,80,247 | 21,713 | 3,87,311 | 1,890 | 4,140 | 5,320 |
| Ranchi | 45,559 | 32,213 | 32,075 | 51,766 | 7,603 | 1,69,216 | 410 | 1,107 | 3,100 |
| Secunderabad | 48,047 | 1,25,453 | 58,355 | 2,00,613 | 21,744 | 4,54,212 | 2,042 | 4,450 | 9,942 |
| Total | 10,07,850 | 14,60,296 | 4,64,480 | 20,34,679 | 2,72,455 | 52,39,760 | 21,618 | 49,388 | 1,17,165 |
What Candidates Should Do Next
Now that application statistics are public, registered candidates must focus entirely on their preparation strategy. Key next steps include:
- Review the official syllabus and exam pattern for RRB Group D Level 1 posts.
- Track your specific zone's updates regarding computer-based test (CBT) dates and city intimation slips.
- Practice mock tests and previous year question papers to gauge performance against the broad applicant pool.
- Keep login credentials safe for easy access when admit cards are released.